

Market Outlook 2026
Market outlook guide, partner presentation system, and campaign assets at scale.
Overview
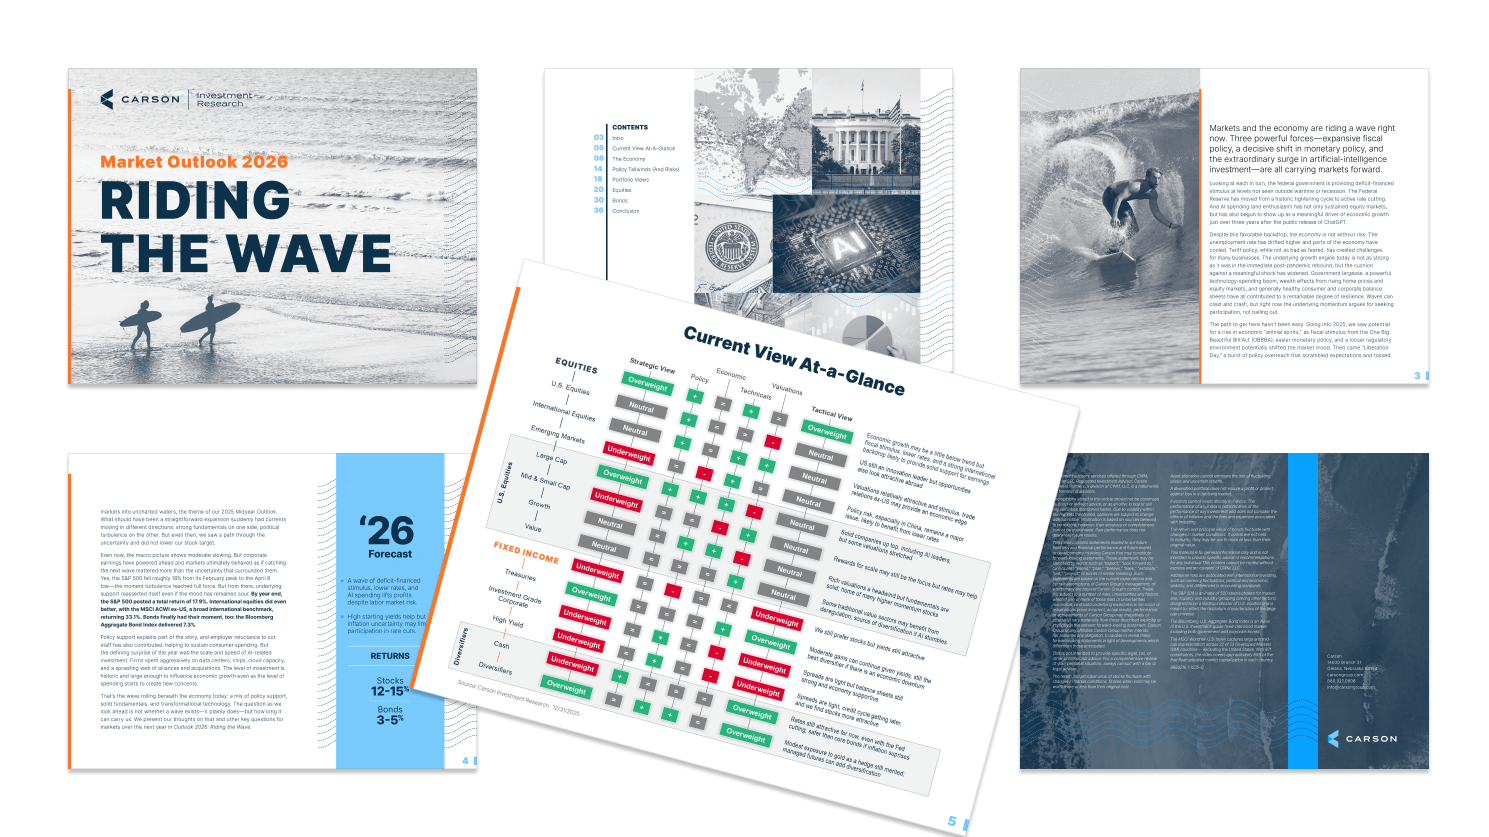
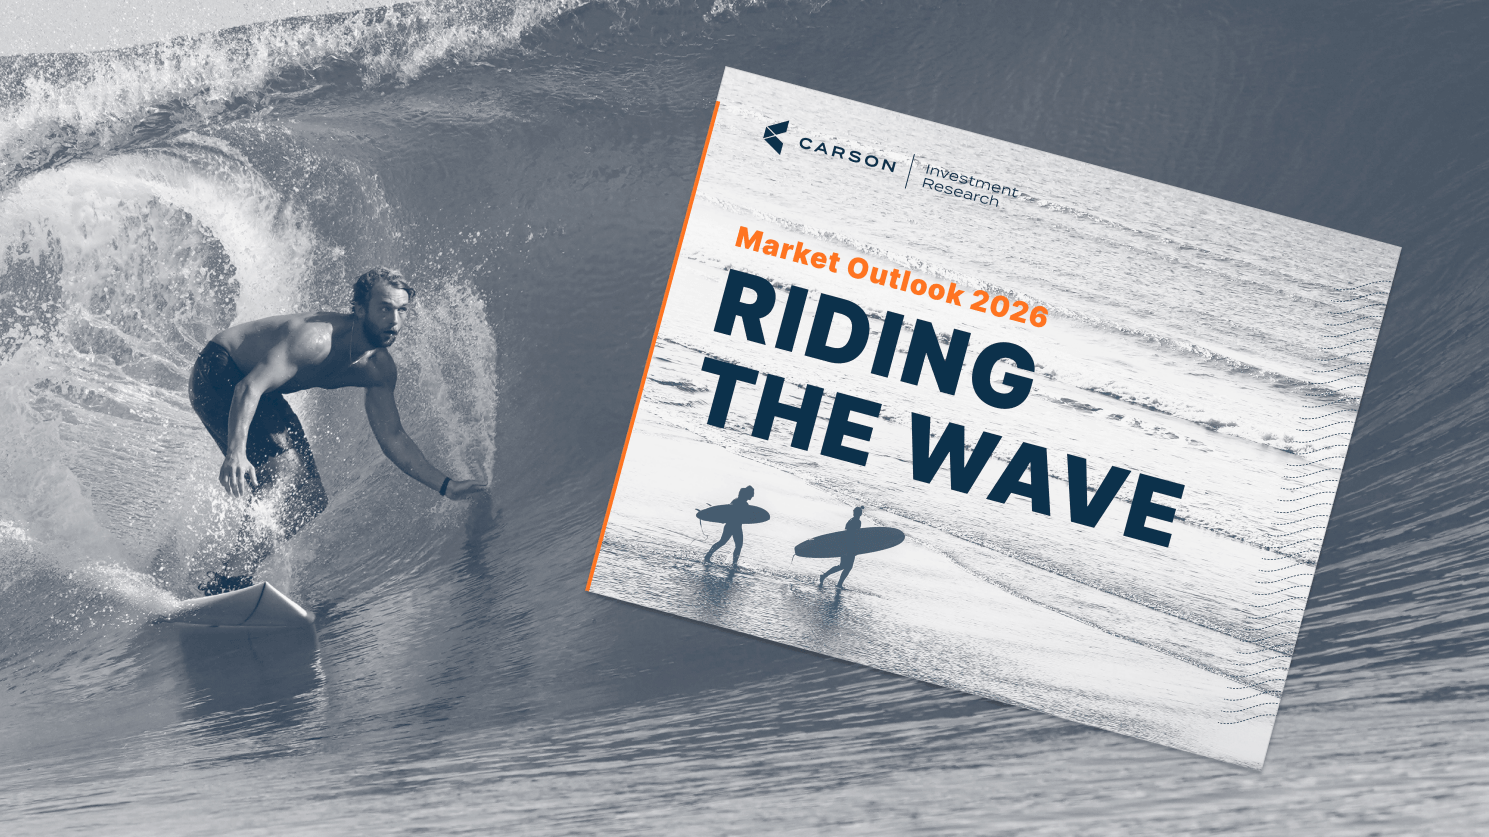
Carson Investment Research's Market Outlook 2026: Riding the Wave is a 38-page annual guide covering the team's economic forecast, equity and fixed income positioning, and portfolio strategy for the year ahead. All copy and source charts were authored by the investment research team. My role was to take their chosen "Riding the Wave" concept and build a cohesive visual system around it—then carry that system across the guide itself, a flexible PowerPoint template, and a set of digital assets for social media and email.
Design + Production
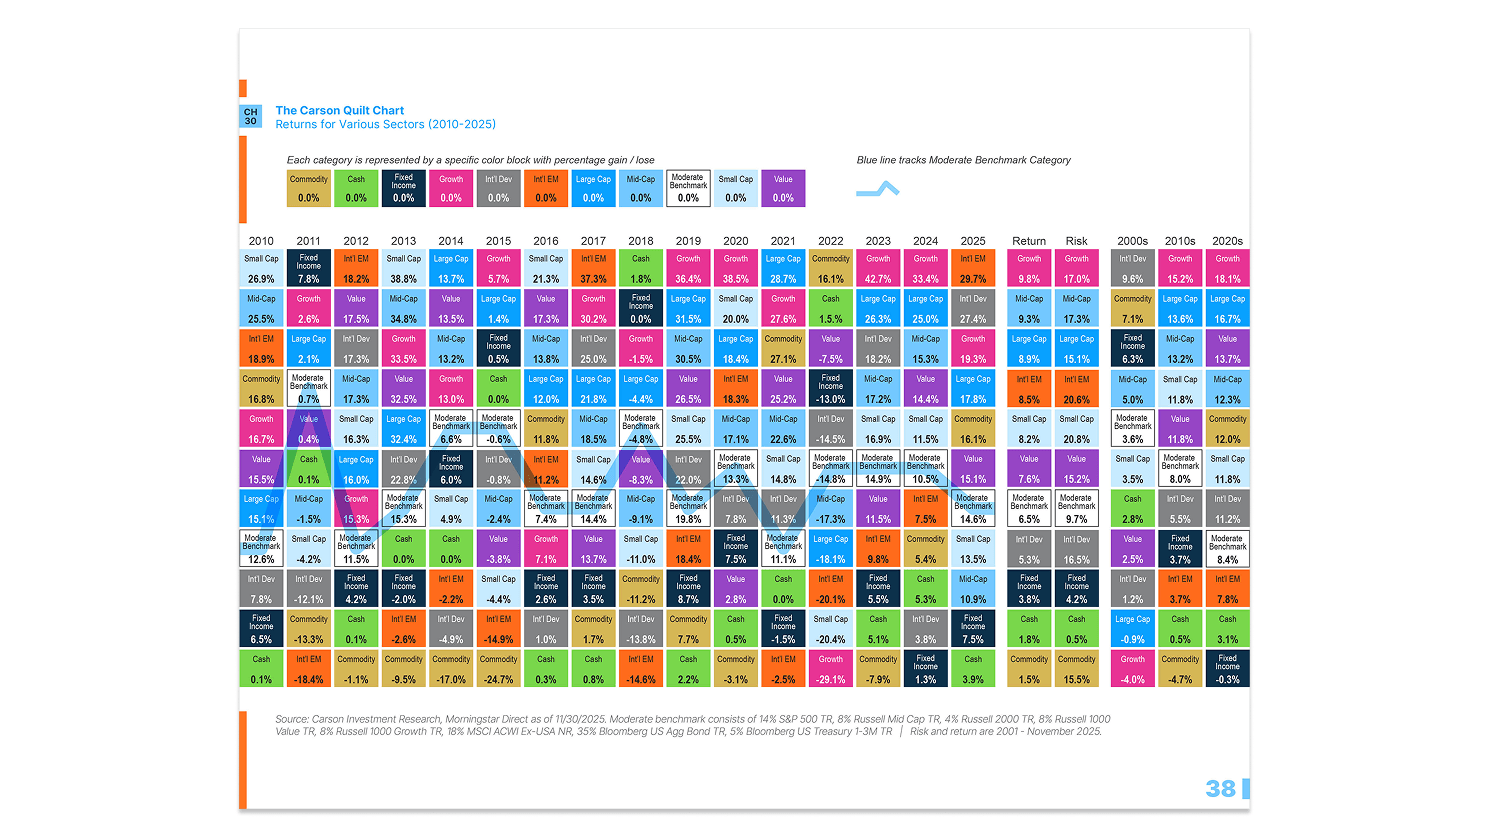
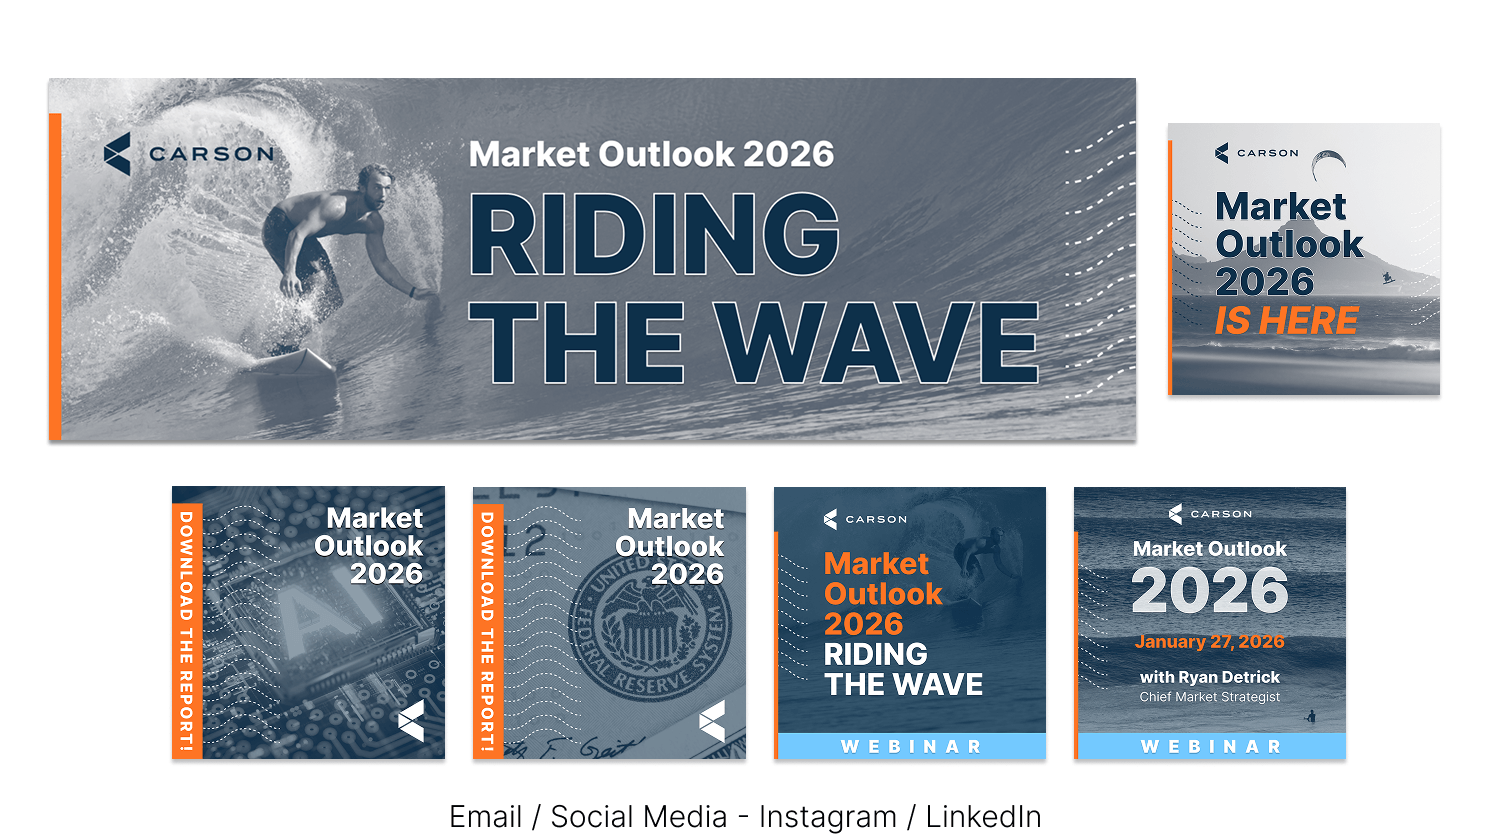
The wave theme drove everything. I developed a visual language rooted in black-and-white surf photography treated with a duotone in the brand's primary blue, supported by blue and orange typography and a set of flowing line elements that carried across section openers, chart pages, and editorial spreads. The guide moves through seven content sections—from macro economy and policy tailwinds through equities, bonds, and a concluding quilt chart—each with its own full-bleed section opener and a consistent system for how charts, callouts, and body copy live on the page.
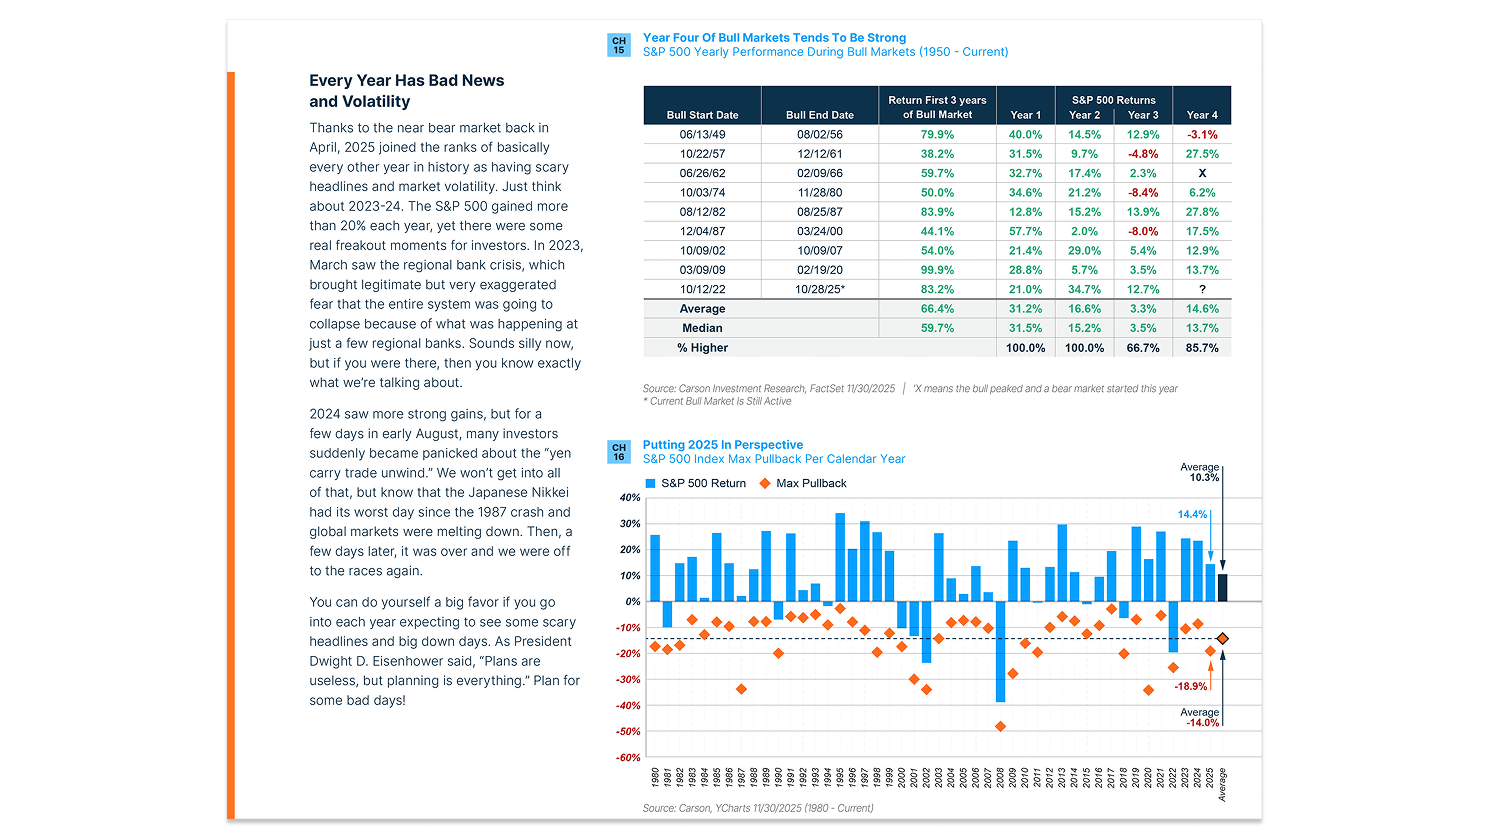
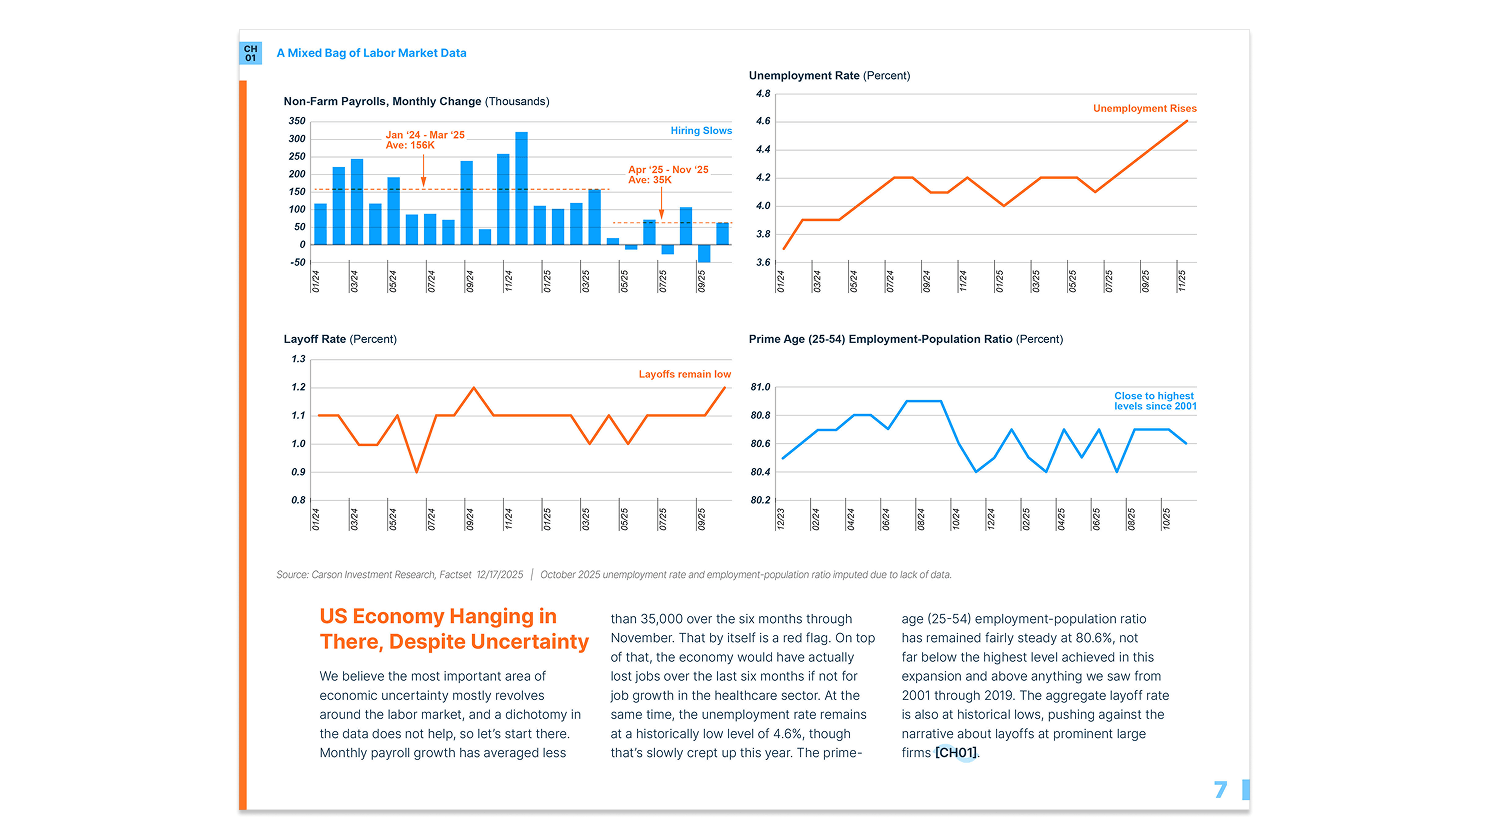
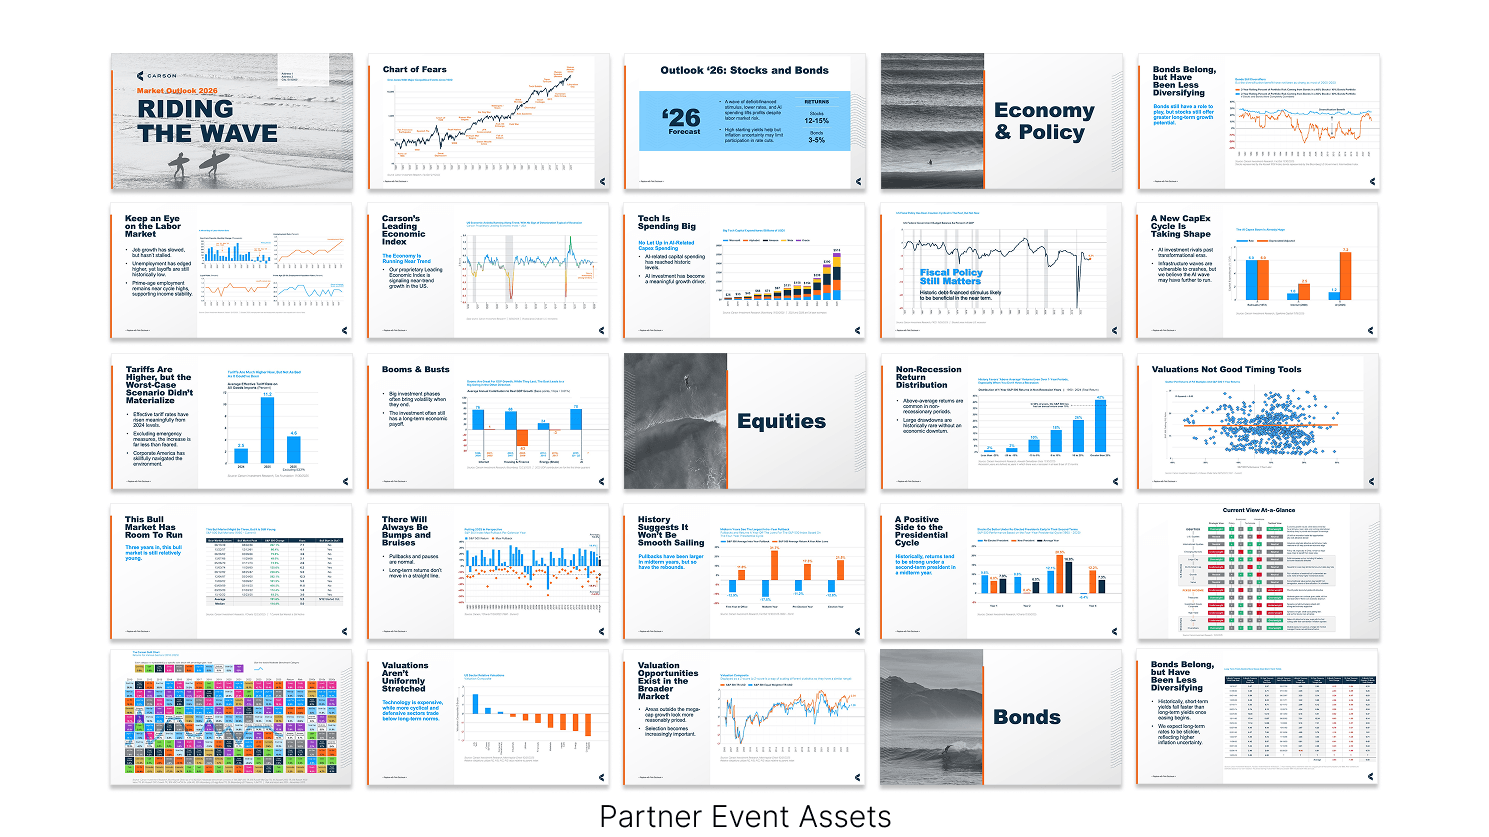
A significant part of the production work was the charts themselves. The investment team provided around 30 charts as raw Excel files. I revamped each one to work within the guide's visual system—establishing a consistent color logic (blue and orange data, clean labeling, Carson-branded source lines) and building them in a way that would also translate into the PowerPoint templates being produced alongside the report.
Presentation System
The accompanying PowerPoint template gave individual investment team members a ready-to-use deck for partner-led events. It pulled key charts and content from the guide but was structured for flexibility—a partner focused on equities, for example, could build a presentation around that section without needing to reconstruct anything. With 145 Carson partners and 50 Carson Wealth partner offices using these materials, the template needed to hold up across a wide range of presenters and audiences without design support for every variation.
Supporting Assets
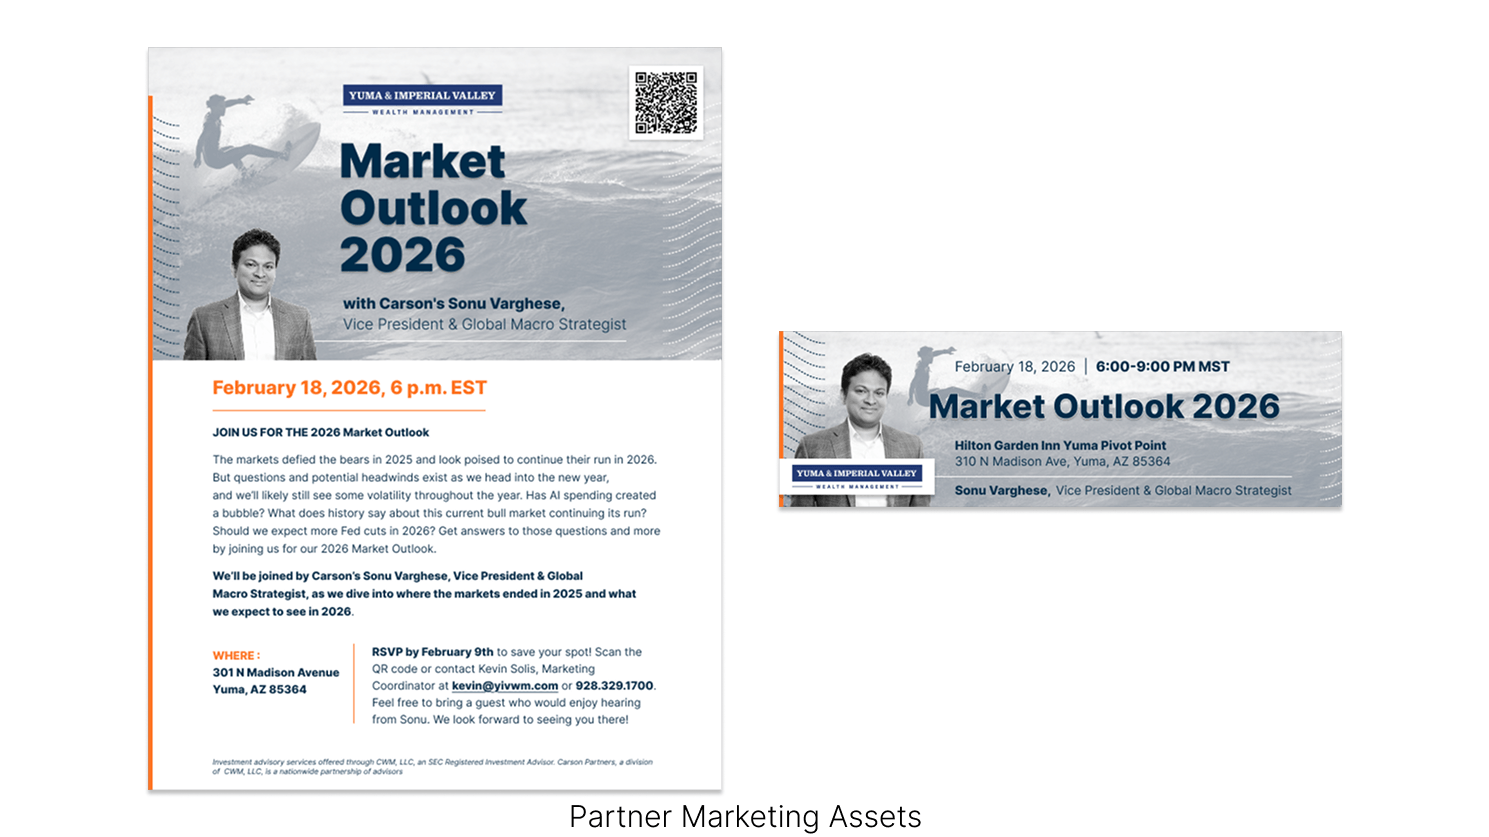
I also produced a set of digital campaign assets to support the guide's release, extending the wave theme and visual identity into formats sized for LinkedIn, X, and email. These gave the marketing team a ready-to-deploy promotional toolkit that matched the guide's look without requiring additional design work at launch.
Outcome
The final deliverable set—guide, presentation system, and campaign assets—gave the investment team a unified, professional toolkit they could distribute at scale on a tight timeline tied to the annual outlook release cycle. The visual system was built to feel authoritative without being rigid, supporting both the depth of a 38-page research publication and the adaptability of a partner-facing presentation environment. Partners had presentation-ready materials they could tailor to their own audiences without needing individual design requests for each event.
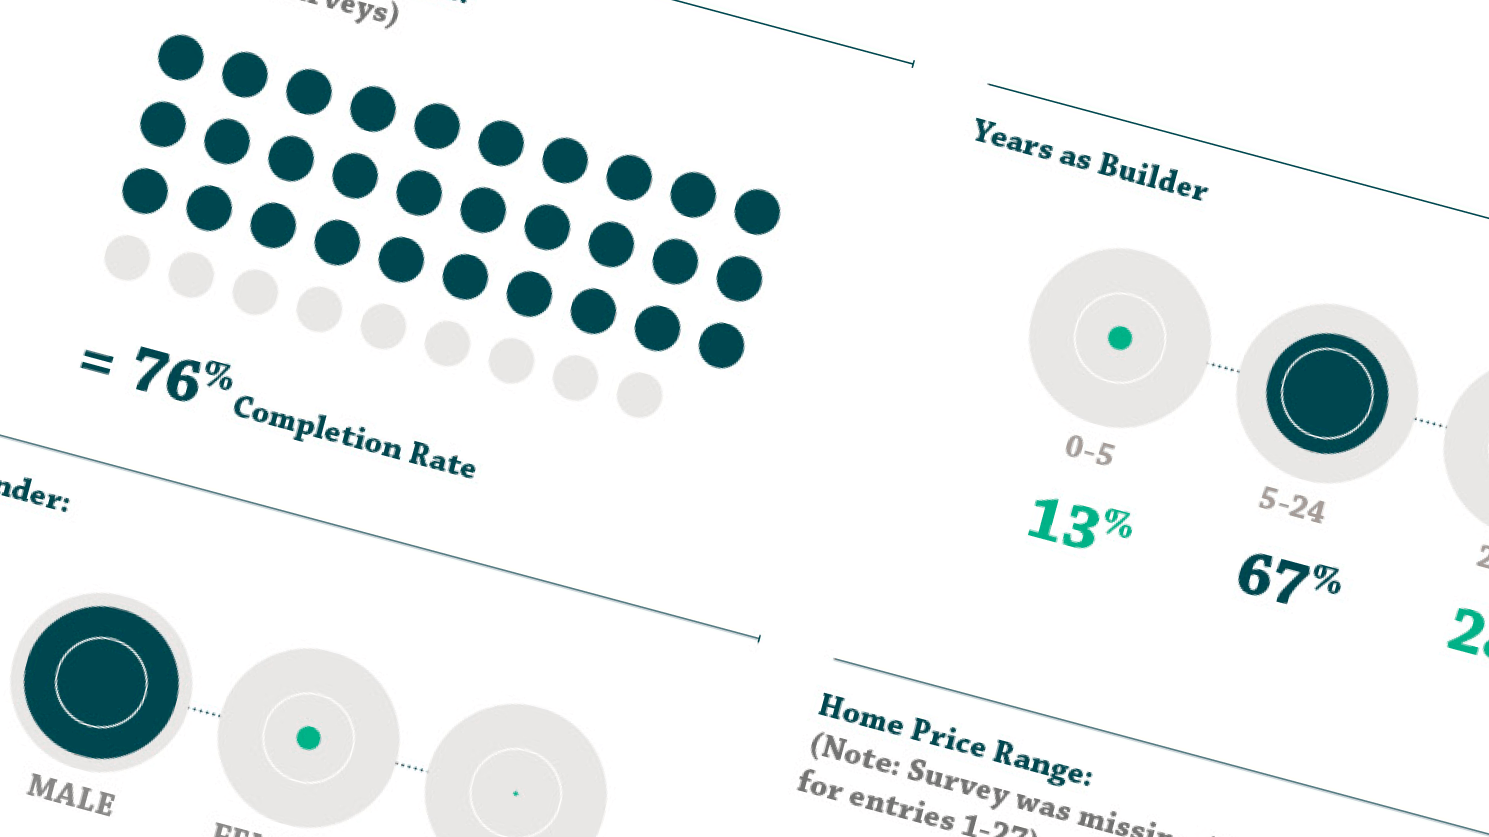
The final images above show samples from the 2025 and 2024 Market Outlook editions, which I also designed and produced with the investment research team. Each year brought a new theme and visual direction, but the same core process applied—translating the team's research and Excel charts into a polished guide, accompanying presentation templates, and supporting campaign assets.


Project gallery